


Lifting Government-Based Burdens for Prosperity
Irrespective of one’s personal beliefs or moral values, the absence of viable refuge due to the universal application of rules carries inherent perils. Should a problem arise that impacts you, as problems inevitably do within any society, be it economic or otherwise, you shall find yourself bereft of options, devoid of choice.
The Government cannot plan the citizens out of poverty and into prosperity. The economy is not a machine to which a few wrenches here and there will solve the problem; the economy is made up of the interactions of individuals conducting themselves via purposeful action; exchanging in the realm of commerce. Nor is the government omniscient; it is comprised of human beings with no access to perfect information, dealing with the same absence of information which creates disequilibrium in the market. As the late Friedrich Hayek stated in his book, The Road to Serfdom:
“The curious task of Economics is to demonstrate to men, how little they really know, about what they imagine they can design.” (Hayek. Road to Serfdom. p. 76).
Rather, the government should relieve burdened weight it imposes on the citizens.
The government can achieve this goal, by enacting reforms to three direct taxes in place:
- Income Tax.
- Corporate Tax.
- Capital Gains Tax.
By reforming into low, flat rate taxes, the government will be allowing for the citizens of the United Kingdom to expand their marginal ranking of goods and services via current consumption choices, give room for a reduction in prices with a larger reinvestment of profits, and a broader incentive and ability towards investment; as well as creating a greater interest in the set-up of new innovative industries.
These newly reformed rates should be represented as follows:
- Income Tax – flat rate 5% on incomes > £12,500 +.
- Corporate Tax – flat rate 10% on profits < & > £300,000.
- Capital Gains Tax – flat rate 8% on annual income < & > £50,000.
The current progressive rates for these taxes, places a high cost and burden on the taxpayers. Additionally it creates a disincentive for work, investment, and production within the UK economy. An analysis of the economic benefits is followed below:
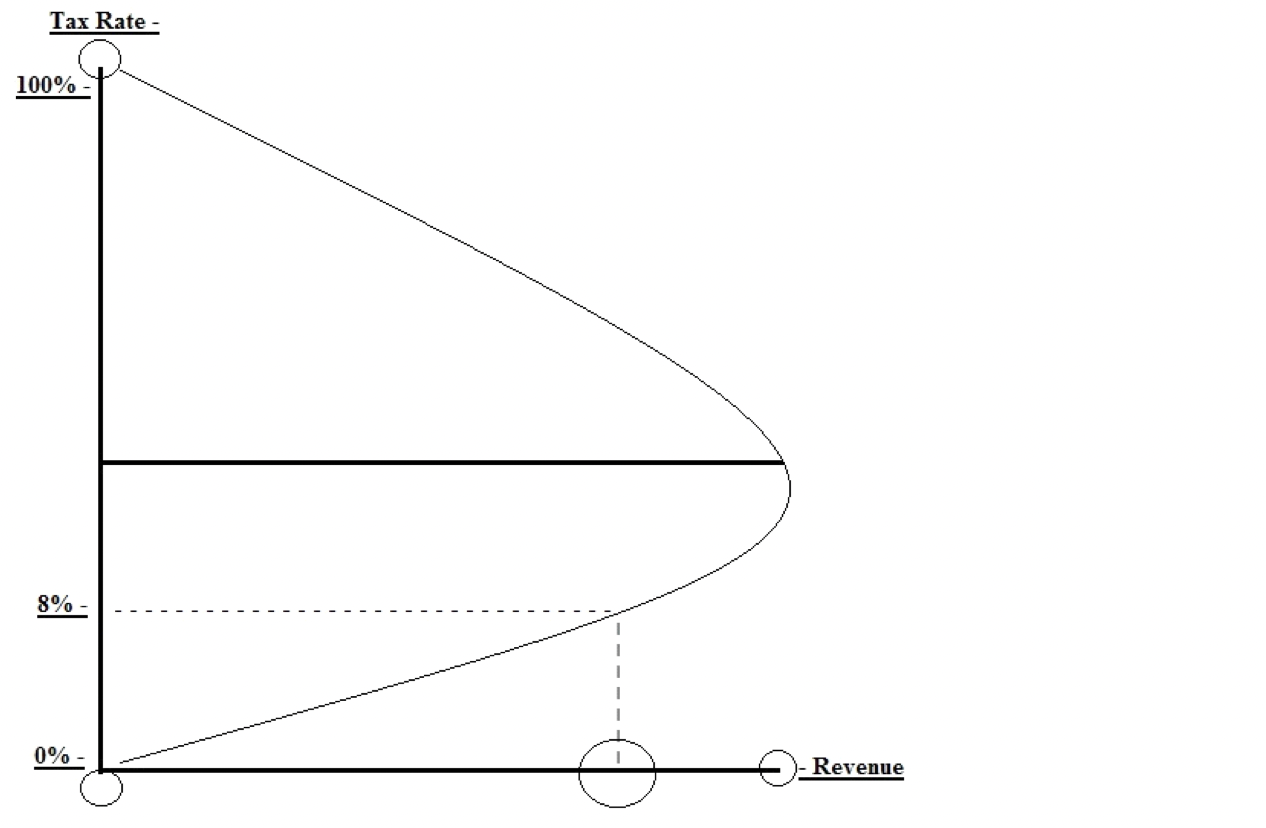
Figure 1
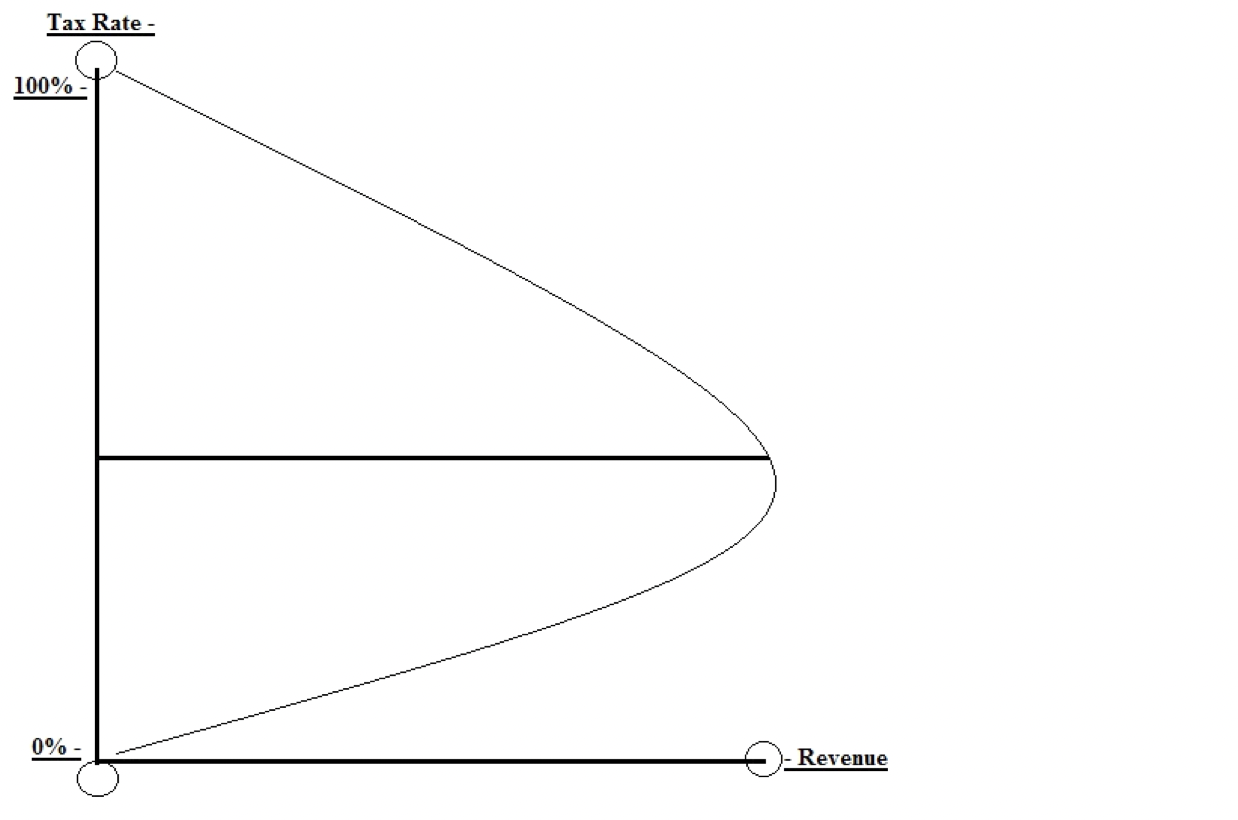
Above we see a draft representation of the Laffer Curve. The Laffer Curve theorises that there are two peak points of a tax rate, at which the government would receive 0 revenue. At the top is a 100% tax rate, at which the government would receive zero revenue due to driving out any and all investments, wages, savings and other means of generating wealth. At the bottom is 0% tax rate, at this point the government receives zero revenue because it places no rate of tax on its citizens and their activities.
While it shows at both these points the government receives 0 revenue, each peak point has different effects on citizens. At the top point the citizens’ economic activity would be non-existent and be put into positions of poverty, while at the bottom point the citizens economic activity, productivity and accumulation of wealth would be at its maximum optimal level; higher tax rates slow economic activity, lower tax rates accelerate economic activity.
To examine what these proposed tax reforms could look like, we take a look at a few further drafts, representing the proposed rates:
Figure 2
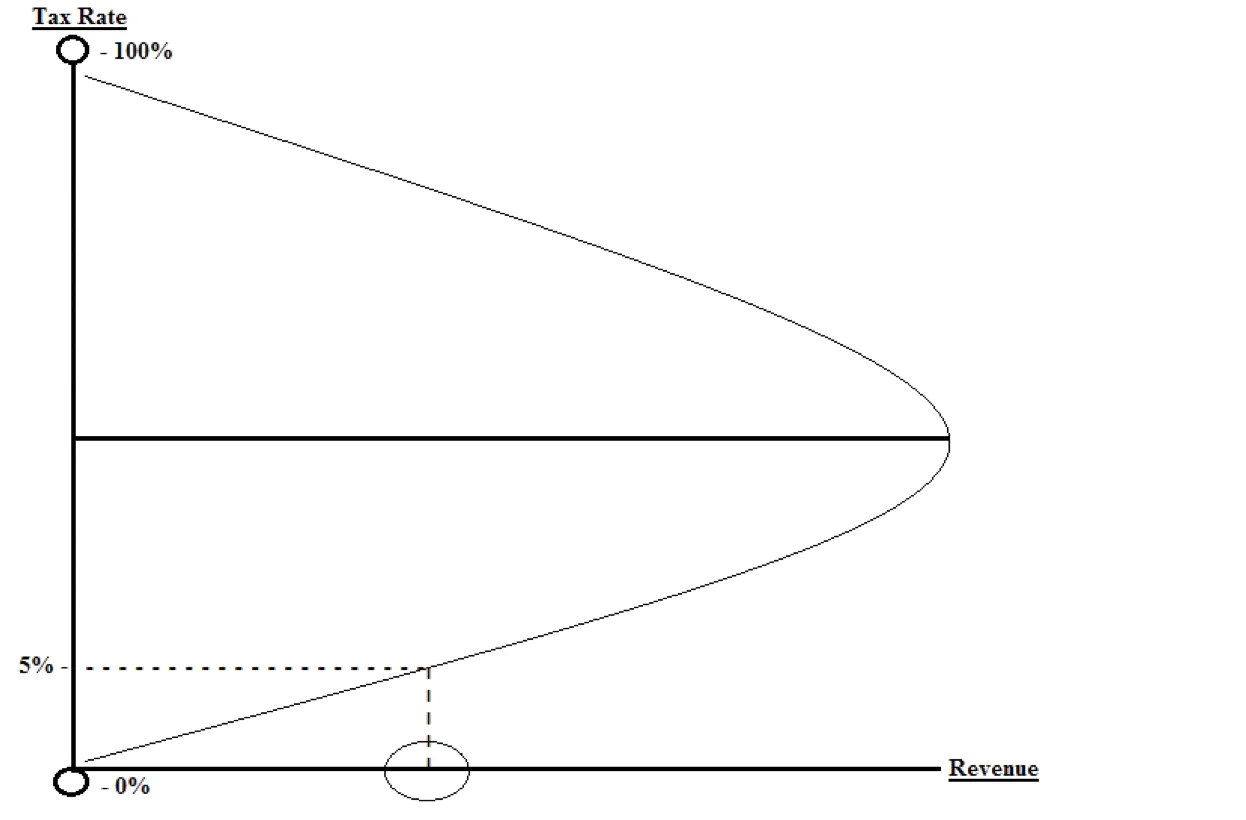
As figure 2 shows, a flat rate income tax of 5% would produce a low stream of revenue in terms of this particular source, however that only looks at the surface, and falls into what French Liberal Economist, Friedrich Bastiat called “the seen and the unseen”.
The unseen area of reform is in the form of an expansion of private economic activity. If the Income Tax is reduced and reformed into a flat rate 5%, the median annual earnings that the citizen has access to will see a sharp increase. This would allow them to expand their marginal ranking of goods and services, and their ability to afford goods and services that they previously were unable to obtain; or could have obtained, but found their marginal utility and demand for what they deemed subjectively of more importance to be higher. Going by the sources of Statista, the median annual earnings in the UK from the 2019 report, was just over £30,000. Under the current rate, the average median earner brings home £24,000; under the proposed rate, he/she would bring home on average £28,500. The average median earner would see their expendable income increase by £4,500 per annum.
As stated above, this would allow the individual earners to expand their marginal rankings of goods and services; obtaining the use of economic goods that they previously did without, or gaining access to better quality substitutes to which better satisfy their time preference of utility.
If we look at the Mangerian representation of marginal utility we get a much clearer picture of this, as represented by figure 3:
Figure 3
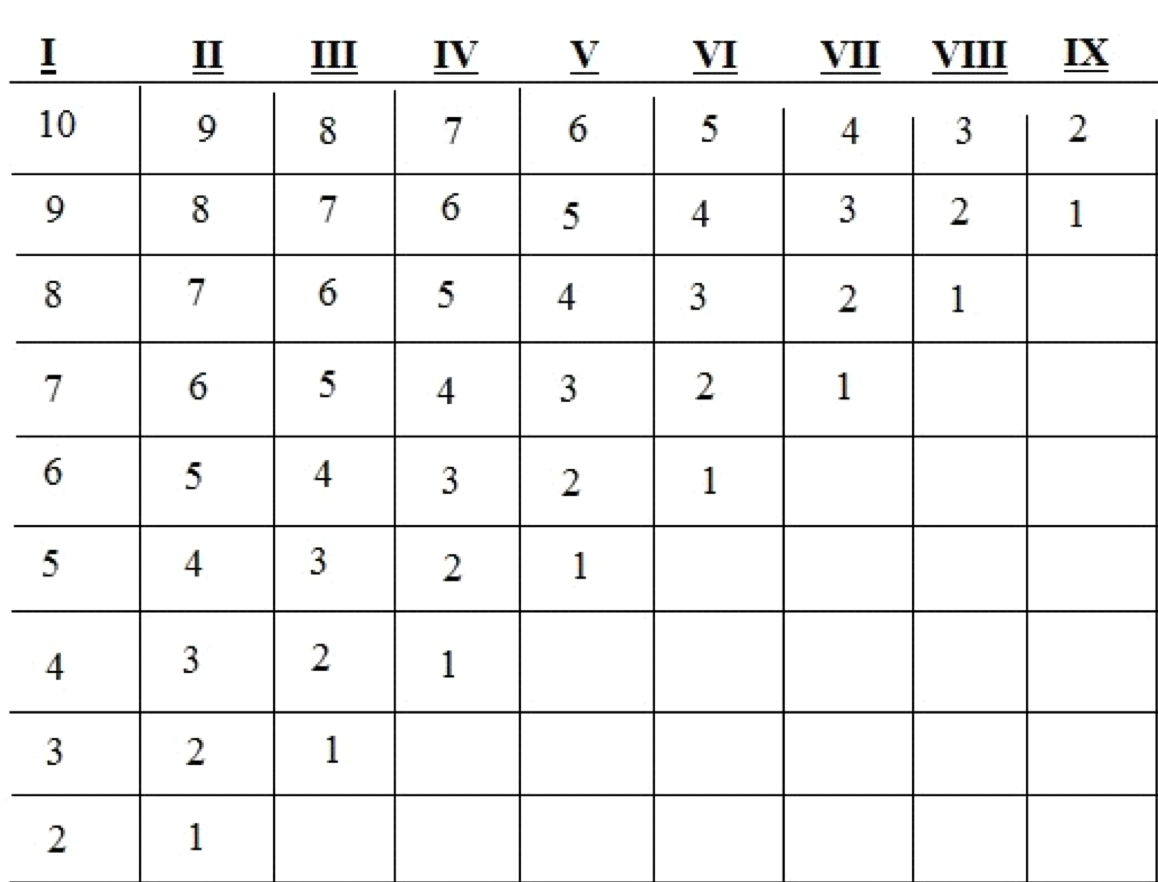
Suppose ‘A’ has an annual income of £30,000; after a progressive income tax ‘A’ is left with £24,000. Additionally suppose ‘A’ has 9 needs/wants in order of importance for satisfaction. These are:
- Owning a Pet.
- Pet Food.
- Leisure.
- Saving.
- Holidays.
Suppose ‘A’ is only able to satisfy six of these needs/wants. Because marginal utility is based on the level of satisfaction = utility, and the lowest want = marginal, ‘A’ would do without the 9th, 8th, and 7th. Under the flat rate 5% however, he is able to satisfy eight of the needs/wants; ‘A’ would do without the 9th.
To put it simply, the expansion of ‘A’s expandable income, would allow for the satisfaction of subjectively less important wants/needs, or establishing the use of substitutes which yield a higher price in current consumption, but to which have a wider time frame so as to be used in future satisfaction. The reform to a 5% flat rate Income Tax has brought greater value about, because more wants/needs are able to be satisfied; therefore, increasing ‘A’s quality of living.
It is important to discuss the additional benefits of a reform to the Income Tax, with regards to saving and investment. In figure 4, we see the effects on saving, if people held greater quantities of their expendable income beyond their current consumption choices:
Figure 4
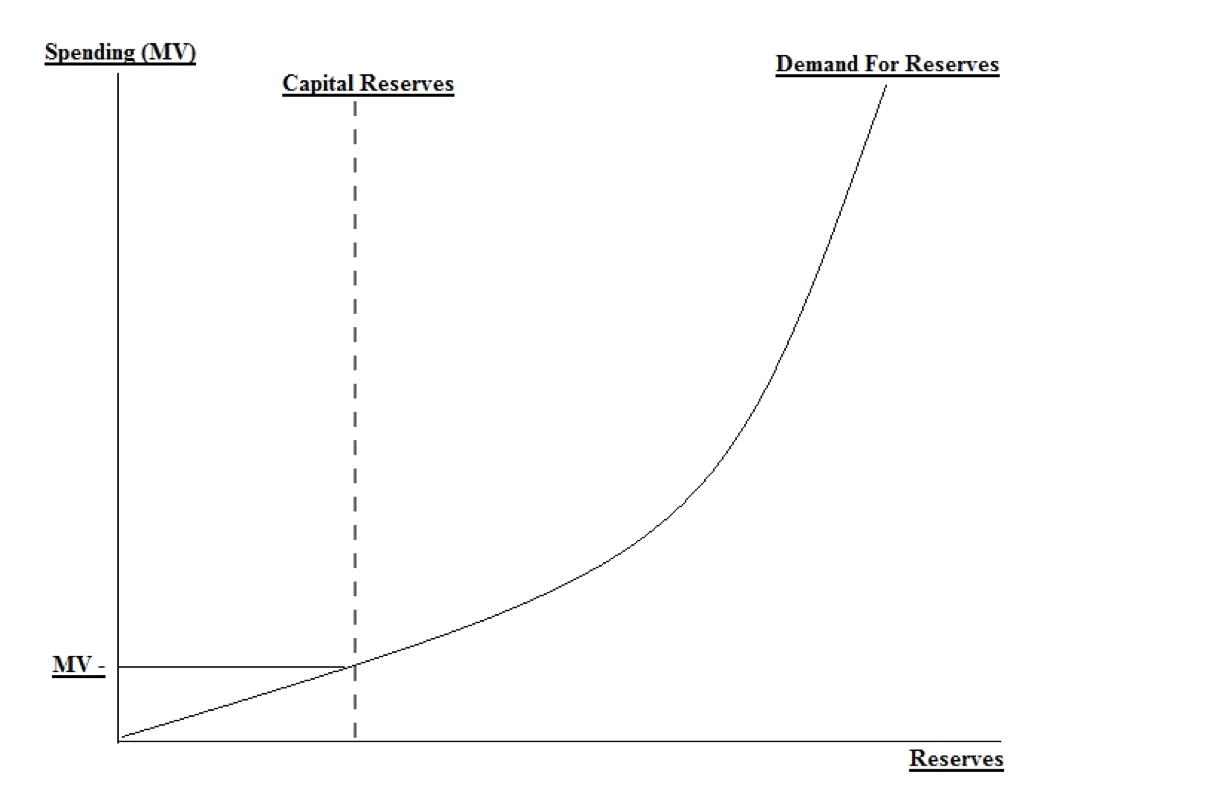
In figure 4, we suppose people’s expendable income under the proposed flat rate income tax, is able to satisfy the marginal utility of goods and services under current consumption. This does not mean people have “more than enough money”, and additional rates can be extorted. This indicates that they are now in a position to hold a value of saving for future consumption; the velocity of money sees a decrease (as people are not performing exchanges for current consumption), and the supply of financial capital under the banking system’s command sees an increase (as people indicate a demand to hold money).
The banks that receive these additional deposits are able to hold a lower reserve rate, and perform more financial investments; such as housing construction, loans to new businesses, and the expansion of capital goods in already developed industries. This would be due to the expansion of real savings; signalling consumers’ time preference for future consumption, and passing information to entrepreneurs and business owners that it is a profitable time for the expansion of production and the creation of new markets.
This brings us to the effects on the Capital Gains Tax, as explained in figure 5:
Figure 5
Similar to what was shown with the flat rate Income Tax; we are presented with another example of Bastiat’s “seen and unseen”. While the rate has been reduced, we remember that taxes are what happen when we combine tax rates with economic behaviour.
With Income and Capital Gains Taxes reformed to flat rates of 5% and 8%, more people have access to their expendable income to take part in investments. Under a progressive tax on gains, we create a disincentive for people to make the risk of investment unless the gains are purported to outstretch the percentage extorted from the tax. Reforming to a flat rate Capital Gains Tax of 8% creates greater incentives for people making investments. Added alongside a flat rate Income Tax of 5%, if people’s preference is based within future consumption more than current, we get an expansion of those able to participate in the investment market; lowering the rate increases the quantity of people able and incentivised to invest.
If we take a look at figure 6, we can visualise the effect a reform to the Capital Gains Tax would have:
Figure 6
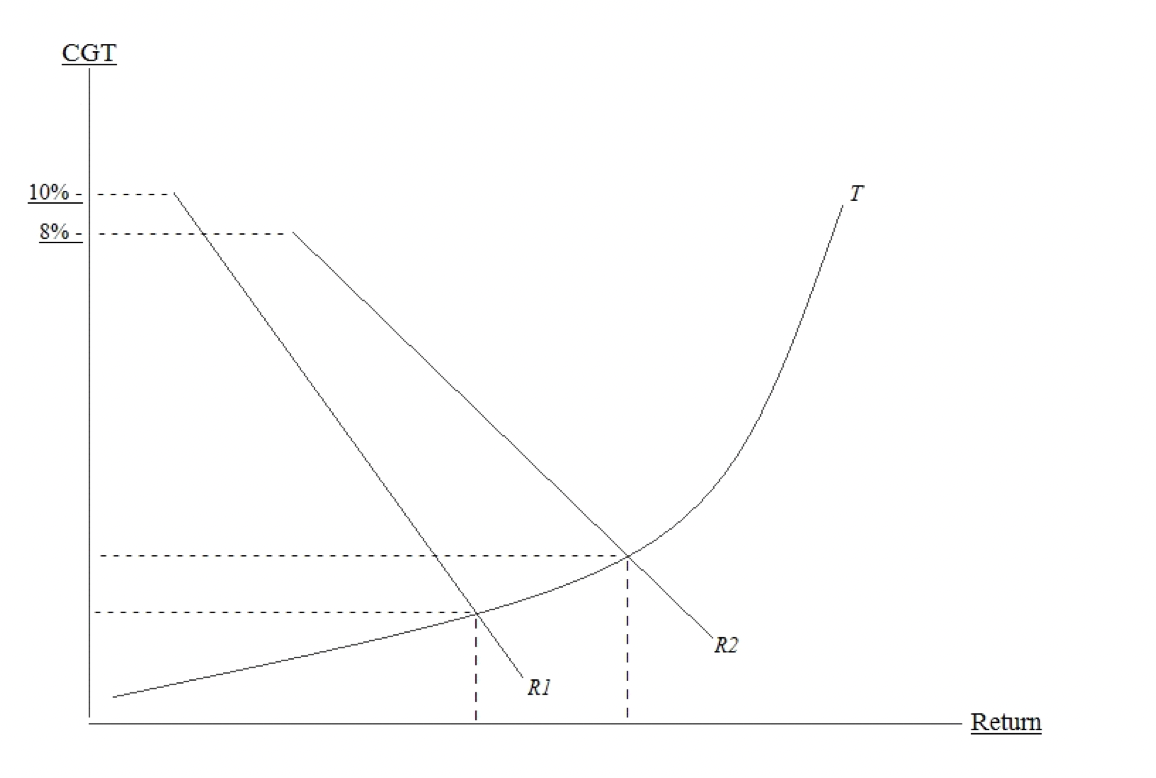
Learn how to describe the purpose of the image (opens in a new tab)In the illustration we see T representing the timeframe of investment, with a reduced rate of return from the Capital Gains Tax, represented as R1. This creates a disincentive for small or first time investors due to a small gain being hit significantly by a progressive rate of tax. By seeing a drop in the Capital Gains Tax to a flat rate of 8%, we see the new rate of returns being higher therefore allowing for a higher incentive for new, small investors due to the ability to keep more earnings; as represented by R2.
What about Corporate Tax?
Below in Figure 7, we see an example of Corporate Tax on the Laffer Curve:
Figure 7
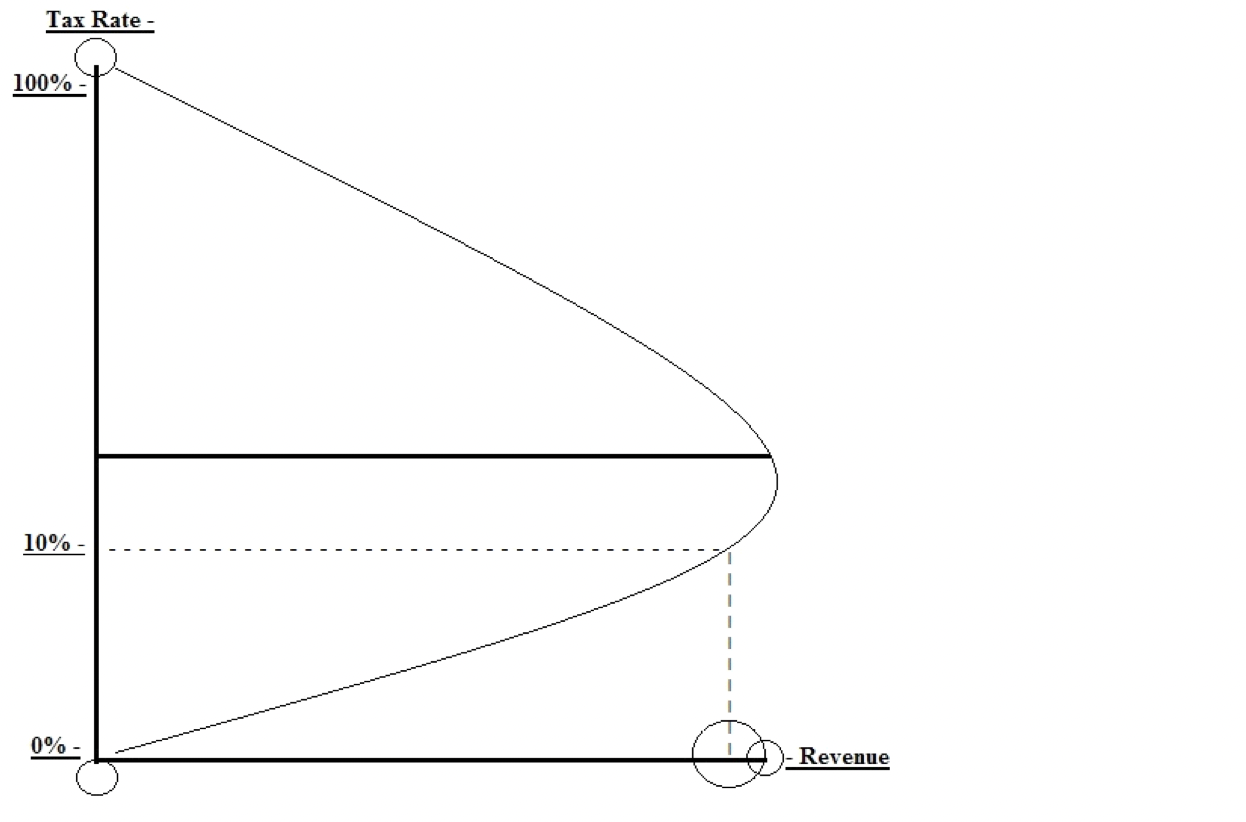
With a flat rate Corporate Tax of 10%, many would argue it’s “unfair” for companies to keep more profits. But profits; similar to prices, are not just mechanisms for incentives. Profits and prices are seldom unfair. They are epistemic; a means of acquiring knowledge about the value judgements of our fellow man. They provide signals of information; if a man makes a profit he has been informed that he perceived information accordingly, if he makes a loss he recognises he misread the signals and miscalculated what information he had available. Any and all regulations, controls, caps and artificial changes of these areas merely obstruct our ability to utilise market signals accordingly; usually at great peril.
Additionally a tax on profits results in either layoffs, reduced production or an increase in the price of final consumer goods, because corporations don’t “pay” taxes; they collect taxes. Reforming the Corporate Tax to a flat rate of 10%, would allow for consumer prices to fall. Alongside the proposed Income Tax of 5%, consumers will face greater incentives and ability via access to more expendable income to spend more on current consumption; either larger quantities than previously, or goods and services that had a much lower ranking in terms of their subjective marginal utilities. Meaning, companies will generate a larger quantity of profits; as a consequence governments will see an expansion of their revenue streams.
Additional illustrations can be seen in figure 8:
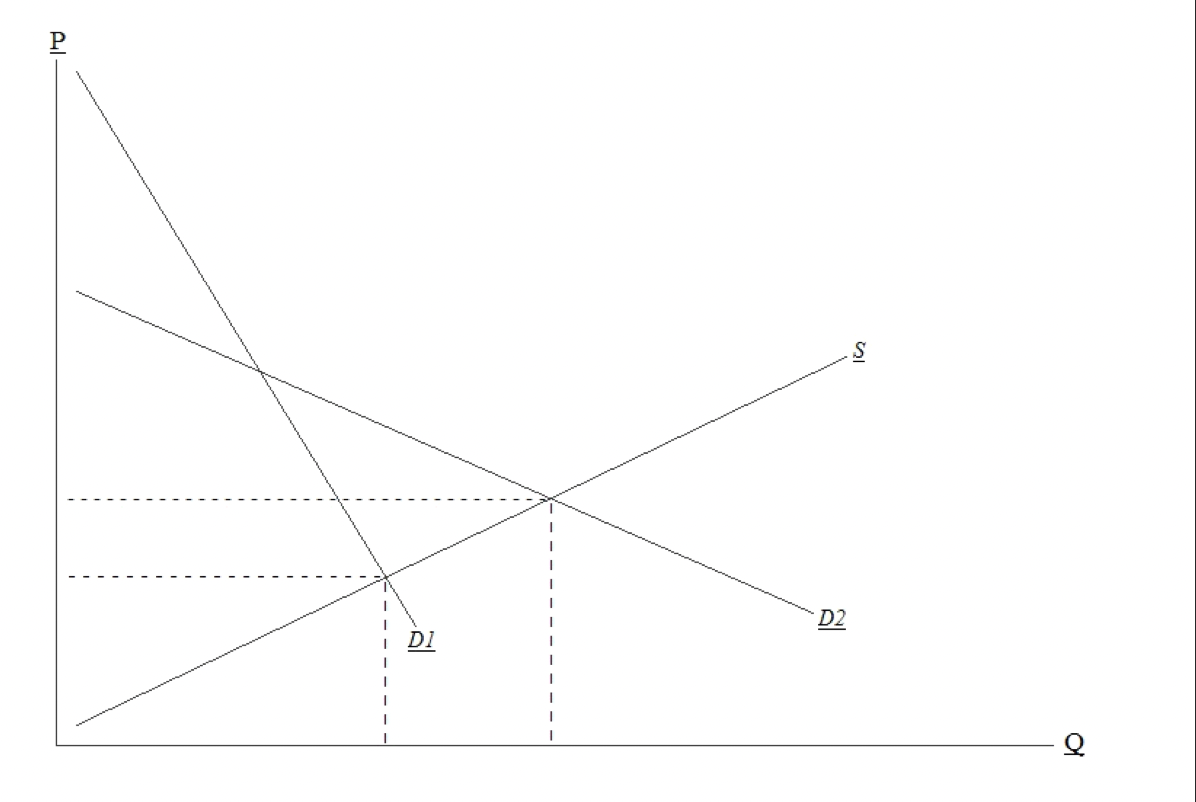
Figure 8
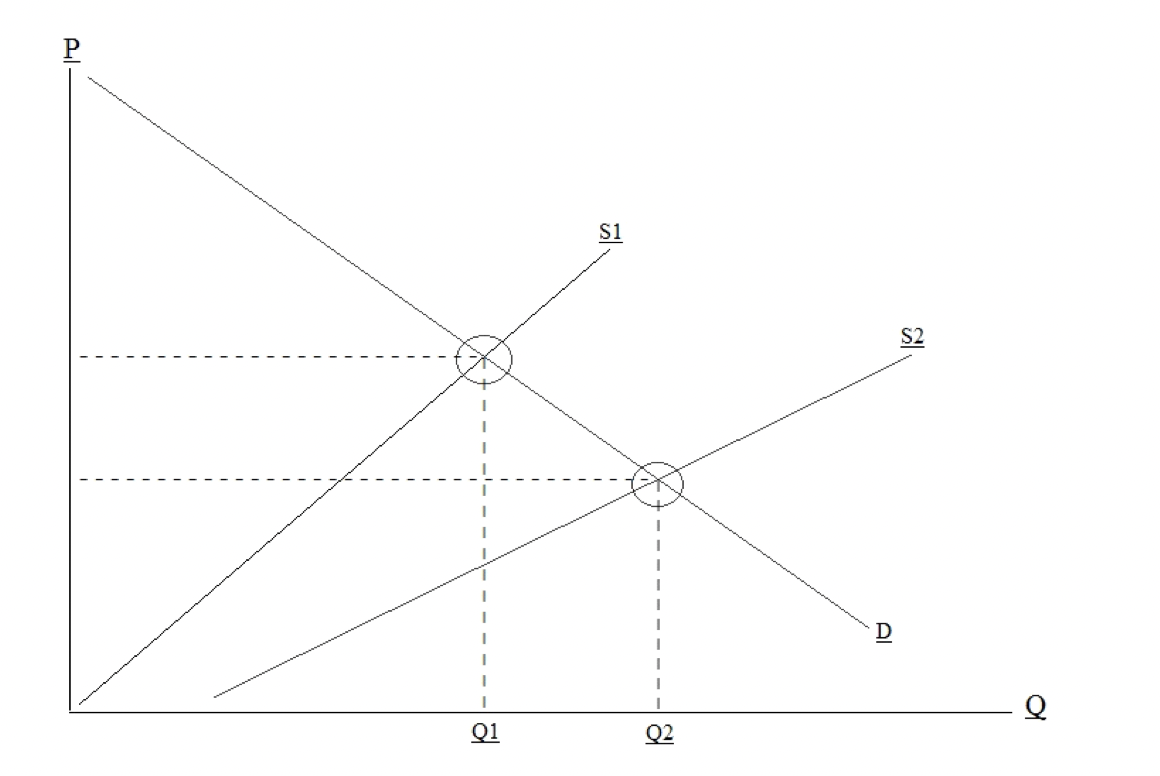
In figure 8 we see the additional pool of profits under the command of the business owner; if reinvested, would allow for the expansion of outputs, or supply. If we assume a case where demand has not seen a sharp increase, then goods available to consumers for future consumption will see a natural decline in price per quantity.
Because taxes are an additional cost passed on to the consumer, even if we suppose the expanded additions of profits are not reinvested, due to the externally imposed additional costs being reduced, we can still see consumer goods see a decline in price for consumers, due to the costs of the producer seeing a reduction, as shown by figure 9:
Figure 9
Simply put, governments will take a smaller amount from a bigger pie, rather than a larger progressive amount from a smaller pie.
Some may argue that, while it would be beneficial to reduce taxes, the public debt compared to GDP is far too large to consider a reduction.
To such a statement, two points should be noted:
- GDP + Government Debt Is A Bad Measurement.
The conventional measurement of a deficit is to compare the size of the economy (GDP) with the government or public debt. This has some issues though. It is not useful nor accurate for measuring a government’s ability to service its debt, because the GDP doesn’t belong to the government. GDP is the total income of businesses and people in a country, and cannot be used for such measurements, because the GDP is not available to the government for paying its debt.
- Lack Of Fiscal Spending.
A better measurement would be to compare Government debt with Government receipts; the amount of money the Government collects in a year from all sources.
If we give the Government some leeway on its debt for the year 2020 and take a look at this ratio from the year 2019, we see the following. First it is important to look at the revenue streams from the financial years of 2009 to 2019; as seen in figure 10:
Figure 10
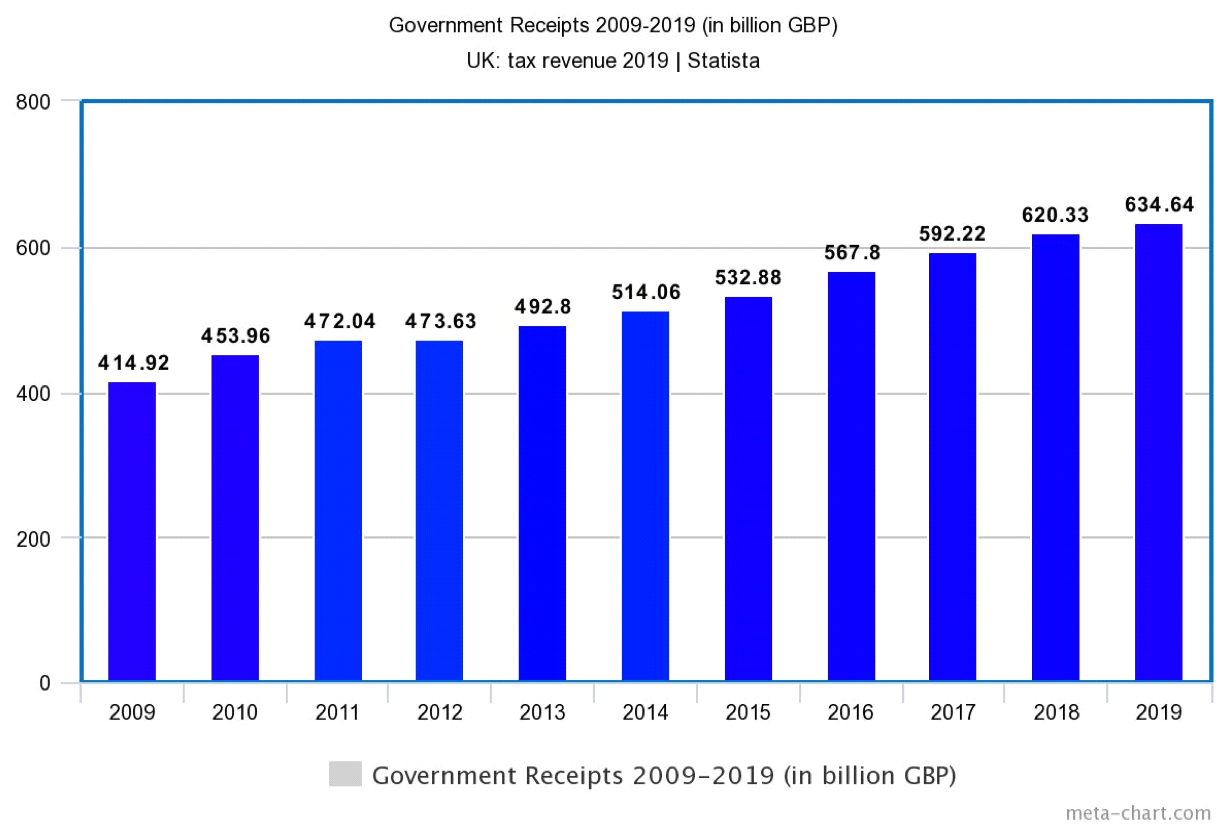
As is shown, the Government receipts in the financial year of 2019 were at 634.64 billion GBP; an increase of 52.95% since the year 2009.
Next we look at the Government receipts compared to Government spending for the year 2019, as shown in figure 11:
Figure 11
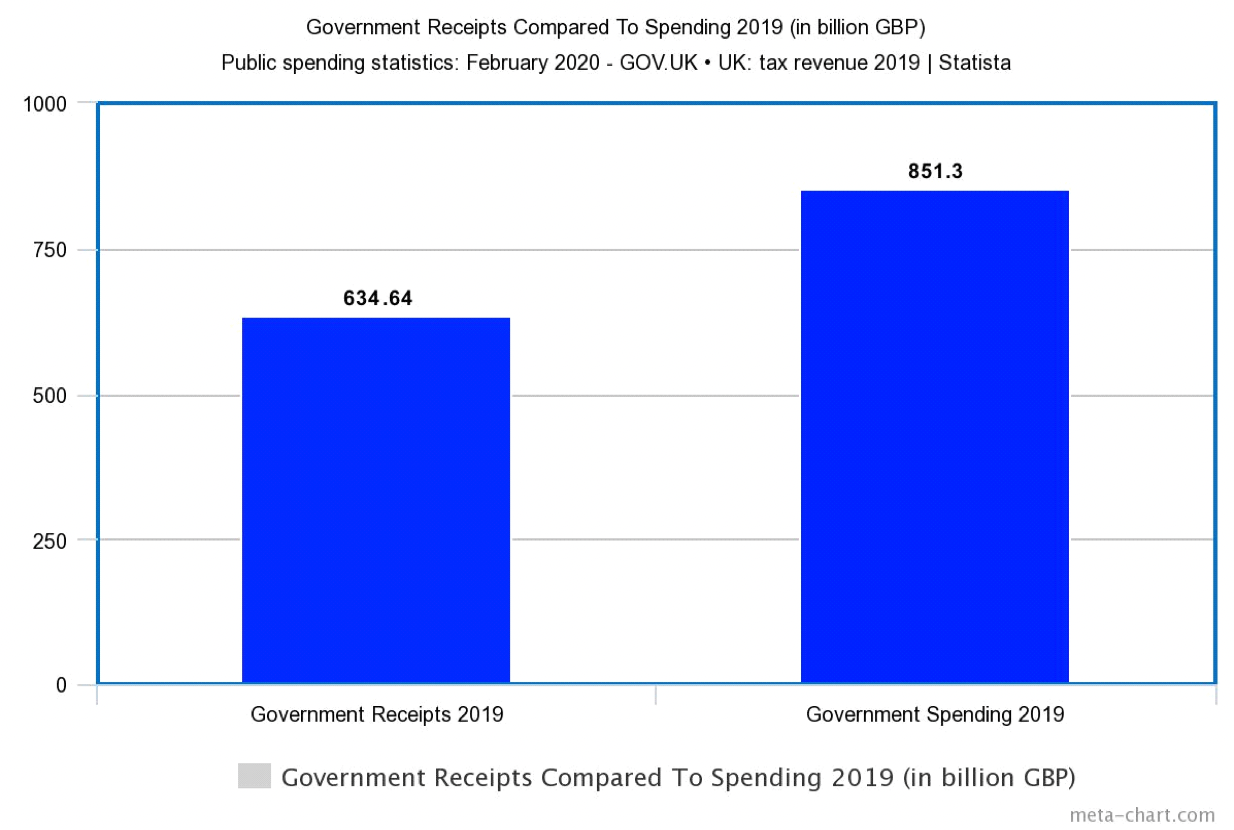
Government spending compared to receipts, was 851.3 billion GBP; which equates to roughly 34.13% higher than all sources of revenue collected by the Government.
Finally let’s look at the Government receipts for the year 2019 as compared to the debt as it stood in 2019; displayed in figure 12.
Figure 12
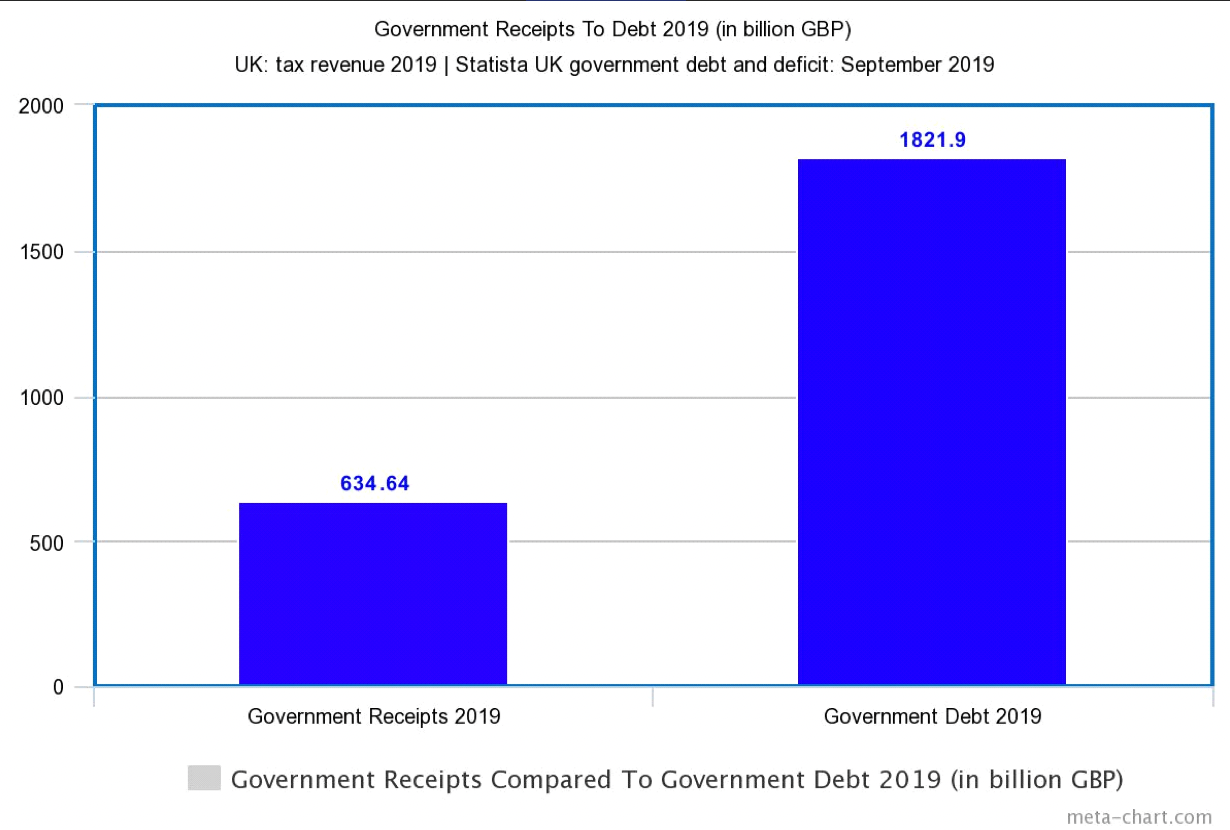
In quite startling results, the government debt in 2019, stood at 1821.9 billion GBP; or 1.8 trillion. The government debt is 187.07% higher than the Government receipts collected from all sources.
The Government doesn’t have a revenue shortage problem; the Government has a spending spree problem.
Direct taxes, such as the three mentioned, are a denial of private property rights. It treats the private property rights; in the form of the fruits of labour, as being loaned by government.
Indirect Taxes, while still extortion, require the sovereign individual to first make a consenting exchange; a quasi-consent based tax. It is a tax to which only applies based on the range of choices he/she makes.
As Frank Chodorov noted in his book The Income Tax: Root of All Evil:
“Freedom of disposition is the substance of property rights. Interference with this freedom of disposition is, in the final analysis, interference with your right to life. At least, that is your reaction to such interference, for you describe such interference with a word that expresses a deep emotion; you call it “robbery”. What’s more, if you find that this robbery persists, if you are regularly deprived of the fruits of your labor, you lose interest in laboring. The only reason you work is to satisfy your desires, and if experience shows that despite your efforts your desires go unsatisfied, you become stingy about laboring. You become a “poor” producer.” (Chodorov. The Income Tax: Root of All Evil. p. 18).
The government would do well to seek a reform of these taxes into low, flat rates formats. Not just for the economic incentives; operation and coordination of market signals and economic actors, but to give respect to the institution of private property rights; that which is so fundamental to the foundations of Liberalism.
Sources –
F.A Heyek: The Road to Serfdom (p. 76.)
Laffer Curve Definition – Investopedia.
Average annual earnings for full-time employees in the UK 1999-2020 – Statista.
Carl Menger: Principles of Economics (pp. 127-130.)
George Selgin: Financial Stability Without Central Banks (p. 6.)
Antony Davies: Understanding Statistics (pp. 37-39.)
UK: tax revenue 2019 | Statista.
Public Spending Statistics: February 2020 – GOV.UK.
Government spending UK 2020 | Statista.
National debt of the United Kingdom (UK) 2019 | Statista.
Frank Chodorov: The Income Tax: Root of All Evil (p. 18.)